
Statistics Class 10 Notes 2026 | Mean, Median, Mode, MCQs, PYQs & Important Questions
Statistics Class 10 Notes
Statistics is one of the most scoring chapters in CBSE Class 10 Mathematics. This chapter helps students learn how to collect, organize, represent, and analyze data using different statistical methods. Questions based on Mean, Median, Mode, Frequency Distribution, and Cumulative Frequency are frequently asked in the CBSE Board Examination. ( Statistics Class 10 ) PREVIOUS TOPIC : QUADRATIC EQUATIONS
In these comprehensive notes, you will learn every concept in simple English and Hindi, along with formulas, solved examples, MCQs, previous year questions (PYQs), HOTS questions, and exam-oriented practice sets.
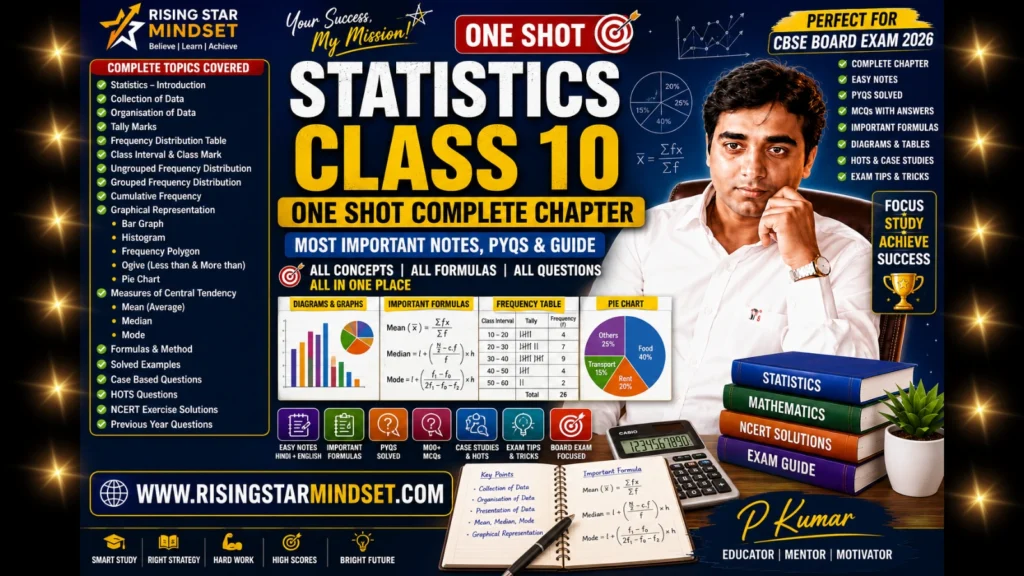
सांख्यिकी (Statistics) कक्षा 10 नोट्स
सांख्यिकी (Statistics) गणित की वह शाखा है जिसमें विभिन्न प्रकार के आँकड़ों (Data) का संग्रह, वर्गीकरण, प्रस्तुतीकरण, विश्लेषण तथा व्याख्या की जाती है।
CBSE बोर्ड परीक्षा में यह अध्याय अत्यंत महत्वपूर्ण माना जाता है क्योंकि इससे प्रतिवर्ष कई अंक के प्रश्न पूछे जाते हैं। यदि विद्यार्थी Mean, Median, Mode तथा Frequency Distribution को अच्छी तरह समझ लें, तो वे इस अध्याय में पूर्ण अंक प्राप्त कर सकते हैं।
Table of Contents ( Statistics Class 10 )
- What is Statistics?
- Meaning of Statistics
- Importance of Statistics
- Real-Life Applications
- Important Terms
- Abbreviations
- Types of Data
- Frequency Distribution
- Class Interval & Calculate Mark
- Frequency
- Cumulative Frequency
- Mean
- Median
- Mode
- Formula Sheet
- Solved Examples
- Key Points
- Practice Questions
- MCQs
- PYQs
- HOTS Questions
- FAQs
- Conclusion
What is Statistics? (English)
Statistics is a branch of Mathematics that deals with the collection, organization, presentation, analysis, and interpretation of numerical data.
Statistics helps us understand large amounts of information and make informed decisions based on data.
सांख्यिकी क्या है? (Hindi)
सांख्यिकी गणित की वह शाखा है जिसमें आँकड़ों का संग्रह, वर्गीकरण, प्रस्तुतीकरण, विश्लेषण तथा व्याख्या की जाती है।
यह हमें उपलब्ध जानकारी को सरल तरीके से समझने और सही निर्णय लेने में सहायता करती है।
Importance of Statistics
Statistics is useful in almost every field of life.
Education
- Student performance analysis
- Result preparation
- Examination statistics
Business
- Profit analysis
- Market research
- Sales forecasting
Government
- Population Census
- Economic Planning
- Employment Survey
Sports
- Player Performance
- Team Ranking
- Match Analysis
Medical Science
- Disease Survey
- Clinical Research
- Health Statistics
सांख्यिकी का महत्व
सांख्यिकी का उपयोग शिक्षा, चिकित्सा, व्यवसाय, खेल, बैंकिंग, कृषि, जनगणना तथा वैज्ञानिक अनुसंधान सहित लगभग सभी क्षेत्रों में किया जाता है।
Learning Outcomes
After studying this chapter, students will be able to:
- Understand statistical data.
- Calculate Mean.
- Find Median.
- Determine Mode.
- Prepare Frequency Distribution Tables.
- Solve CBSE Board Questions.
- Interpret statistical data correctly.
Abbreviations ( Statistics Class 10 )
| Abbreviation | Full Form | हिन्दी |
| CF | Cumulative Frequency | संचयी आवृत्ति |
| CI | Class Interval | वर्ग अंतराल |
| CM | Class Mark | वर्ग चिन्ह |
| f | Frequency | आवृत्ति |
| N | Total Frequency | कुल आवृत्ति |
| h | Class Size | वर्ग चौड़ाई |
| l | Lower Boundary | निम्न सीमा |
| U | Upper Boundary | उच्च सीमा |
| Mean | Arithmetic Mean | माध्य |
| Median | Median | मध्यिका |
| Mode | Mode | बहुलक |
Important Definitions
Data
Data means numerical information collected for a specific purpose.
हिन्दी: किसी विशेष उद्देश्य के लिए एकत्रित संख्यात्मक जानकारी को डेटा कहते हैं।
Observation
Each individual value in a data set is called an observation.
हिन्दी: डेटा का प्रत्येक मान प्रेक्षण कहलाता है।
Frequency
The number of times an observation occurs is called frequency.
हिन्दी: किसी मान के आने की संख्या को आवृत्ति कहते हैं।
Frequency Distribution
A table showing observations and their frequencies is called a frequency distribution table.
हिन्दी: जिसमें प्रत्येक मान तथा उसकी आवृत्ति दिखाई जाए, उसे आवृत्ति वितरण सारणी कहते हैं।
Class Interval
The difference between the upper limit and lower limit of a class is called the class interval.
Example:
10–20
20–30
30–40
Center value
It is the midpoint of a class interval.
Formula
class midpoint = (Upper Limit + Lower Limit) ÷ 2
Example
20–30
CM = (20 + 30) ÷ 2
= 25
Types of Data ( Statistics Class 10 )
Ungrouped Data
Data that is not arranged into groups.
Example
12, 15, 20, 17, 19
Grouped Data
Data arranged into class intervals.
Example
| Marks | Frequency |
| 0–10 | 5 |
| 10–20 | 8 |
| 20–30 | 12 |
Formula Sheet ( Statistics Class 10 )
Mean
Mean (x̄) = Σfx / Σf
Median
M = l + [(N/2 − CF) / f] × h
Where
l = Lower Boundary of Median Class

N = Total Frequency

CF = Cumulative Frequency before Median Class

f = Frequency of Median Class

h = Class Width
Mode
Mode = Observation having maximum frequency.
Class Mark = (Upper Limit + Lower Limit) / 2
Class Size = Upper Boundary- Lower Boundary
Key Points
- Statistics deals with numerical data.
- Mean is the arithmetic average.
- Median represents the middle value.
- Mode is the most frequently occurring observation.
- Frequency indicates how many times a value occurs.
- Cumulative Frequency is the running total of frequencies.
- Class Mark is the midpoint of a class interval.
- Grouped data is commonly used for large datasets.
- Statistical analysis helps in decision-making.
- Statistics is widely used in education, business, sports, medicine, and research.
Mean (Arithmetic Mean) ( Statistics Class 10 )
English Explanation
The Arithmetic Mean is the average value of all observations. It is obtained by adding all the values and dividing the sum by the total number of observations.
The Mean is one of the most commonly used measures of central tendency.
Formula (Ungrouped Data)
Mean = Sum of Observations / Number of Observations
Mean = Σx / n
Where
- Σx = Sum of observations
- n = Number of observations
हिन्दी व्याख्या
माध्य (Mean) सभी प्रेक्षणों का औसत (Average) होता है।
सभी मानों का योग करके उन्हें कुल मानों की संख्या से भाग दिया जाता है।
सूत्र
माध्य = सभी मानों का योग ÷ कुल मानों की संख्या
Mean for Grouped Data
When data is arranged in classes, we use Frequency.
Formula Mean=∑f / ∑fx
Where
f = Frequency
x = Class Mark
Example
| Class | f | Class Mark(x) | fx |
| 0-10 | 3 | 5 | 15 |
| 10-20 | 5 | 15 | 75 |
| 20-30 | 2 | 25 | 50 |
Total Frequency =10
Σfx=140
Mean
140÷10
=14
Median
English Explanation
Median is the middle value of an ordered data set.
Arrange observations in ascending order before finding the Median.
हिन्दी व्याख्या
मध्यिका (Median) किसी व्यवस्थित आँकड़ों का बीच का मान होता है।
मध्यिका Median निकालने से पहले डेटा को छोटे से बड़े क्रम में व्यवस्थित करना आवश्यक है।
Median Formula (Grouped Data)
Median = l + [(N/2 − CF) / f] × h
Where
l = Lower Boundary of Median Class

N = Total Frequency

CF = Cumulative Frequency before Median Class

f = Frequency of Median Class

h = Class Width
Steps to Find Median
Step 1
Calculate cumulative frequency.
Step 2
Find N/2.
Step 3
Locate Median Class.
Step 4
Apply Formula.
Example
| Marks | Frequency |
|---|---|
| 0-10 | 5 |
| 10-20 | 8 |
| 20-30 | 12 |
| 30-40 | 15 |
Total Frequency
40
N/2
20
Median Class
20-30
Mode
English Explanation
Mode is the observation that occurs most frequently.
It is useful when identifying the most common value.
हिन्दी व्याख्या
बहुलक (Mode) वह मान होता है जिसकी आवृत्ति सबसे अधिक होती है।
Difference Between Mean, Median and Mode
| Mean | Median | Mode |
|---|---|---|
| Average | Middle Value | Most Frequent Value |
| Affected by extreme values | Less affected | Not affected much |
| Uses all observations | Middle observation | Highest frequency |
Cumulative Frequency ( Statistics Class 10 )
English
Cumulative Frequency is the running total of frequencies.
हिन्दी
संचयी आवृत्ति (CF) क्रमशः आवृत्तियों का जोड़ होती है।
Example
| Frequency | CF |
|---|---|
| 5 | 5 |
| 7 | 12 |
| 10 | 22 |
| 8 | 30 |
Less Than Type CF
| Marks | CF |
|---|---|
| <10 | 5 |
| <20 | 12 |
| <30 | 22 |
| <40 | 30 |
More Than Type CF
| Marks | CF |
|---|---|
| >0 | 30 |
| >10 | 25 |
| >20 | 18 |
| >30 | 8 |
Class Interval
Example
10–20
20–30
30–40
40–50
Class Width
Formula
Upper Boundary − Lower Boundary
Example
10–20
Width =10
Class Mark
Formula
(Upper Limit + Lower Limit) ÷2
Example
20–30
=25
Graphical Representation
Statistics can also be represented using
- Histogram
- Frequency Polygon
- Ogive
- Bar Graph
- Pie Chart
Solved Example 2
Find Mean
15
20
18
22
25
Solution
Sum
100
Observations
5
Mean
20
Solved Example 3
Find Mode
5
7
7
8
9
7
10
Answer
Mode=7
Solved Example 4
Arrange and Find Median
18
12
20
25
15
Arrange
12
15
18
20
25
Median
18
Common Mistakes
- Forgetting to arrange observations before Median.
- Wrong cumulative frequency.
- Wrong class mark.
- Forgetting class width.
- Calculation mistakes.
Key Points ( Statistics Class 10 )
| Mean = Average |
| Median = Middle Observation |
| Mode = Highest Frequency |
| CF = Running Total |
| Statistics deals with data. |
| Median Class is important. |
| Formula-based chapter. |
| Easy scoring in Board Exams. |
50 Most Important Multiple Choice Questions (MCQs)
Q1. Statistics is the study of:
A) Numbers only
B) Data collection and analysis
C) Geometry
D) Algebra
✅ Answer: B
Q2. Which is the measure of central tendency?
A) Mean
B) Median
C) Mode
D) All of these
✅ Answer: D
Q3. Mean is also called:
A) Average
B) Maximum
C) Minimum
D) Frequency
✅ Answer: A
Q4. Median is:
A) Largest value
B) Smallest value
C) Middle value
D) Difference
✅ Answer: C
Q5. Mode is:
A) Highest value
B) Lowest value
C) Most frequently occurring value
D) Average
✅ Answer: C
Q6. Frequency means:
A) Sum of observations
B) Number of times an observation occurs
C) Difference
D) Product
✅ Answer: B
Q7. CF stands for:
A) Central Frequency
B) Class Frequency
C) Cumulative Frequency
D) Continuous Frequency
✅ Answer: C
Q8. Class Mark is:
A) Upper Limit
B) Lower Limit
C) Midpoint of a class interval
D) Difference of limits
✅ Answer: C
Q9. Formula of Class Mark is:
A) UL − LL
B) (UL + LL) ÷ 2
C) UL × LL
D) UL ÷ LL
✅ Answer: B
Q10. Which graph is used for cumulative frequency?
A) Histogram
B) Pie Chart
C) Ogive
D) Bar Graph
✅ Answer: C
Q11–Q20 ( Statistics Class 10 )
- Statistics deals with ______.
✅ Data - Median is affected by extreme values.
✅ False - Mean uses all observations.
✅ True - Mode is always unique.
✅ False - Histogram represents grouped data.
✅ True - Total frequency is denoted by:
✅ N - Arithmetic Mean is represented by:
✅ Mean - Running total is called:
✅ Cumulative Frequency - Median divides data into:
✅ Two equal parts - Frequency cannot be negative.
✅ True
Q21–Q30 ( Statistics Class 10 )
- The average of observations is:
✅ Mean - The middle observation is:
✅ Median - Maximum frequency gives:
✅ Mode - Statistics belongs to:
✅ Mathematics - Population census uses:
✅ Statistics - Business forecasting uses:
✅ Statistics - Median requires:
✅ Ordered Data - Mean is:
✅ Arithmetic Average - Mode is useful for:
✅ Most common observation - Class Width means:
✅ Upper Boundary − Lower Boundary
Q31–Q40 ( Statistics Class 10 )
- Frequency Distribution represents:
✅ Data and Frequencies - Grouped Data contains:
✅ Class Intervals - Ungrouped Data has:
✅ Individual Observations - Median Formula includes:
✅ CF - Mean Formula includes:
✅ Σfx - Statistics helps in:
✅ Decision Making - Data can be:
✅ Grouped and Ungrouped - Histogram has:
✅ Adjacent Rectangles - Ogive represents:
✅ Cumulative Frequency - Mean is:
✅ Average
Q41–Q50
- Which chapter is scoring in CBSE?
✅ Statistics - Statistics uses:
✅ Numerical Data - Class Mark is:
✅ Midpoint - Median Class contains:
✅ N/2 Observation - Mean uses:
✅ Sum of fx - Statistics helps in:
✅ Analysis - Frequency is:
✅ Number of occurrences - CF means:
✅ Running Total - Statistics is useful in:
✅ Every field - Best preparation for Statistics:
✅ NCERT + PYQs + MCQs
Assertion and Reason Questions
Q1
Assertion (A): Mean is the average of observations.
Reason (R): Mean uses all observations.
A. Both A and R are true, and R is the correct explanation of A.
✅ Answer: A
Q2
Assertion: Median is affected by extreme values.
Reason: Median is the middle observation.
✅ Answer: Assertion is False, Reason is True.
Q3
Assertion: Mode is the most frequent observation.
Reason: Mode has the highest frequency.
✅ Answer: A
Q4
Assertion: Frequency can be negative.
Reason: Frequency represents the number of occurrences.
✅ Answer: Assertion False, Reason True.
Q5
Assertion: Statistics is useful in business.
Reason: Statistics helps in decision-making.
✅ Answer: A
इसी पैटर्न पर आप 20 Assertion-Reason प्रश्न बना सकते हैं।
Fill in the Blanks (20)
- Statistics deals with ________. (Data)
- Mean is also called ________. (Average)
- Median is the ________ value. (Middle)
- Mode is the ________ occurring observation. (Most Frequently)
- CF stands for ________. (Cumulative Frequency)
- Frequency is the number of ________. (Occurrences)
- Class Mark is the ________ of a class interval. (Midpoint)
- Statistics belongs to ________. (Mathematics)
- Median divides the data into ________ equal parts. (Two)
- Mean uses ________ observations. (All)
- Histogram is used for ________ data. (Grouped)
- Ogive represents ________. (Cumulative Frequency)
- Class Width = Upper Boundary − ________. (Lower Boundary)
- Total Frequency is denoted by ________. (N)
- Arithmetic Mean is a measure of ________. (Central Tendency)
- Data can be ________ or ungrouped. (Grouped)
- Mode is based on ________. (Frequency)
- Statistics helps in ________ making. (Decision)
- Mean Formula contains ________. (Σfx)
- Median Formula contains ________. (CF)
True / False
- Statistics deals with numerical data. ✅ True
- Mean is the average. ✅ True
- Median is the highest value. ❌ False
- Mode is the least frequent value. ❌ False
- Frequency cannot be negative. ✅ True
- Histogram represents grouped data. ✅ True
- Ogive shows cumulative frequency. ✅ True
- Mean uses all observations. ✅ True
- Median requires arranged data. ✅ True
- Statistics is useful in daily life. ✅ True
One-Word Answer Questions
- Average → Mean
- Middle Value → Median
- Most Frequent Value → Mode
- Running Total → Cumulative Frequency
- Midpoint → Class Mark
- Number of Occurrences → Frequency
- Total Frequency → N
- Graph of Cumulative Frequency → Ogive
- Data Table → Frequency Distribution
- Arithmetic Average → Mean
Statistics Class 10 Important Questions & Answers (Board Exam 2026)
Short Answer Questions (2 Marks)
Q1. What is Statistics?
Answer (English):
Statistics is the branch of Mathematics that deals with collecting, organizing, analyzing, interpreting, and presenting numerical data.
उत्तर (हिन्दी):
सांख्यिकी गणित की वह शाखा है जिसमें आँकड़ों का संग्रह, वर्गीकरण, विश्लेषण, व्याख्या तथा प्रस्तुतीकरण किया जाता है।
Q2. Define Frequency.
Answer:
The number of times an observation occurs is called its frequency.
हिन्दी: किसी मान के आने की संख्या को उसकी आवृत्ति (Frequency) कहते हैं।
Q3. What is a Frequency Distribution Table?
Answer:
A table showing observations and their corresponding frequencies is called a Frequency Distribution Table.
Q4. What is Class Interval?
Answer:
The difference between the upper limit and lower limit of a class is called the Class Interval.
Q5. What is Class Mark?
Answer: Class Mark= ( Upper Limit+Lower Limit ) / 2
Long Answer Questions (3–5 Marks)
Q6. Find the Mean of the following data.
| Marks | Frequency |
| 10–20 | 4 |
| 20–30 | 6 |
| 30–40 | 8 |
| 40–50 | 2 |
Solution
| Class | f | x | fx |
| 10–20 | 4 | 15 | 60 |
| 20–30 | 6 | 25 | 150 |
| 30–40 | 8 | 35 | 280 |
| 40–50 | 2 | 45 | 90 |
- Σf = 20
- Σfx = 580
Answer: Mean = 29
Q7. Explain the importance of Statistics in daily life.
Answer:
Statistics is useful in:
- Education
- Business
- Medical Science
- Banking
- Agriculture
- Sports
- Government Planning
- Population Census
- Weather Forecasting
- Scientific Research
CBSE Previous Year Questions (PYQs)
PYQ 2025
Question:
Find the Mean of the following grouped data.
(Students should use the formula Σfx/Σf .)
PYQ 2024
Question:
Calculate the Median from the given frequency distribution table.
PYQ 2023
Question:
Find the Mode of the following observations.
PYQ 2022
Question:
Prepare the cumulative frequency table.
PYQ 2021
Question:
Find the Class Mark of the given class intervals.
HOTS Questions
Q1
Why is Median preferred over Mean when data contains extremely large or small values?
Answer:
Because Median is not greatly affected by extreme values (outliers), while Mean changes significantly.
Q2
Can two different datasets have the same Mean?
Answer:
Yes. Different datasets may have the same average but different distributions.
Q3
A class has the same Mean and Median. What can you infer?
Answer:
The data may be approximately symmetrical.
Q4
Which measure of central tendency is most suitable for determining the most popular shoe size sold in a shop?
Answer:
Mode, because it identifies the most frequently occurring value.
Q5
Why is Statistics important in weather forecasting?
Answer:
It helps analyze historical weather data to predict future weather conditions.
Competency-Based Questions
Case Study 1
A teacher recorded the Mathematics marks of 40 students and prepared the following frequency distribution table.
| Marks | Frequency |
| 0–10 | 2 |
| 10–20 | 5 |
| 20–30 | 8 |
| 30–40 | 10 |
| 40–50 | 9 |
| 50–60 | 6 |
Questions
- What is the total frequency?
- Which class has the highest frequency?
- Which measure helps identify the most common score?
- What is the class width?
- Is the data grouped or ungrouped?
Answers
- 40
- 30–40
- Mode
- 10
- Grouped Data
Case Study 2
A hospital recorded the ages of patients admitted in one week.
| Age | Frequency |
| 0–10 | 4 |
| 10–20 | 7 |
| 20–30 | 12 |
| 30–40 | 10 |
| 40–50 | 5 |
| 50–60 | 2 |
Questions
- Which age group has the maximum frequency?
- Which statistical measure identifies this group?
- What is the total frequency?
- Calculate the class mark of 20–30.
- Name the type of data.
Answers
- 20–30
- Mode
- 40
- 25
- Grouped Data
Board Exam Tips
| Memorize all formulas. |
| Learn Mean, Median, and Mode separately. |
| Practice NCERT examples first. |
| Solve at least the last 5 years’ CBSE questions. |
| Draw tables neatly. |
| Write formulas before calculations. |
| Check arithmetic carefully. |
Common Mistakes to Avoid
| Not arranging data before finding the Median. |
| Incorrect cumulative frequency |
| Wrong class mark calculation. |
| Missing units in answers. |
| Skipping the formula. |
Revision Checklist
- Meaning of Statistics
- Types of Data
- Frequency
- Frequency Distribution
- Class Interval
- Class Mark
- Mean Formula
- Median Formula
- Mode
- Cumulative Frequency
- Histogram
- Ogive
- PYQs
- MCQs
- HOTS
Statistics Class 10 FAQs (Schema Ready)
1. What is Statistics?
Answer: Statistics is the branch of Mathematics that deals with collecting, organizing, analyzing, interpreting, and presenting numerical data.
हिन्दी: सांख्यिकी गणित की वह शाखा है जिसमें आँकड़ों का संग्रह, वर्गीकरण, विश्लेषण और व्याख्या की जाती है।
2. What is Mean?
Mean is the arithmetic average of all observations.
3. What is Median?
Median is the middle value of an ordered data set.
4. What is Mode?
Mode is the observation having the highest frequency.
5. What is Frequency?
Frequency is the number of times an observation occurs.
6. What is Cumulative Frequency?
Cumulative Frequency is the running total of frequencies.
7. What is Class Interval?
The difference between the upper and lower limits of a class.
8. What is Class Mark?
The midpoint of a class interval.
Formula:
(Upper Limit + Lower Limit) ÷ 2
9. Which chapter is easiest in Class 10 Maths?
Statistics is one of the easiest and highest-scoring chapters.
10. Is Statistics important for CBSE Board Exam?
Yes. Every year, 3–5 marks questions are generally asked from this chapter.
11. Which formula is most important?
Mean Formula
12. Which graph is used for Cumulative Frequency?
Ogive
13. Which graph is used for grouped data?
Histogram
14. What is grouped data?
Data arranged in class intervals.
15. What is ungrouped data?
Individual observations without grouping.
16. Is NCERT enough?
Yes, but practice PYQs and MCQs for better preparation.
17. Which measure is least affected by extreme values?
Median
18. Which measure identifies the most common value?
Mode
19. How can I score full marks?
Practice NCERT, formulas, PYQs, MCQs, and sample papers regularly.
20. Where can I find complete Class 10 Notes?
You can study complete CBSE Class 10 Notes on www.risingstarmindset.com.
50 Quick Revision Points
- Statistics deals with numerical data.
- Mean is the average.
- Median is the middle value.
- Mode is the most frequent value.
- Frequency means number of occurrences.
- CF means Cumulative Frequency.
- Histogram represents grouped data.
- Ogive represents cumulative frequency.
- Mean uses all observations.
- Median requires ordered data.
- Mode identifies the most common value.
- Class Mark is the midpoint.
- Statistics is used in business, medicine, sports, banking, research & census.
- Grouped data uses class intervals.
- Ungrouped data contains individual values.
- Mean is affected by extreme values.
- Median is less affected by outliers.
- Mode depends on frequency.
- Frequency cannot be negative.
- Class Width = Upper Boundary − Lower Boundary.
- Arithmetic Mean is commonly used.
- Tables improve data presentation.
- Graphs simplify interpretation.
- Statistics helps in prediction.
- Decision-making depends on data.
- NCERT examples are important.
- PYQs improve confidence.
- MCQs improve speed.
- Formula practice is essential.
- Read the question carefully.
- Arrange data before finding Median.
- Check cumulative frequency.
- Write formulas before solving.
- Avoid calculation mistakes.
- Draw neat tables.
- Practice daily.
- Revise weekly.
- Learn definitions.
- Understand concepts.
- Solve competency-based questions.
- Revise formulas regularly.
- Attempt mock tests.
- Manage exam time wisely.
- Stay confident.
- Statistics is a scoring chapter.
Conclusion
Statistics is one of the most important and scoring chapters in CBSE Class 10 Mathematics. By understanding concepts like Mean, Median, Mode, Frequency Distribution, and Cumulative Frequency, students can solve most examination questions with confidence. Regular practice of NCERT examples, MCQs, PYQs, and competency-based questions will help students perform exceptionally well in the CBSE Board Examination 2026.
Keep Learning, Keep Growing! 🚀
P Kumar | Rising Star Mindset
www.risingstarmindset.com
Together We Will Make The Difference